Each market in a post becomes one image, up to 10. You choose the markets, their names and their order, then which statistics appear on the images and the period they cover. Changes save as you make them, except a new name for a market, which you save in its own window.
You make these choices on a post’s Design Your Post page, which opens when you create a post (see Create a post), and on a schedule’s page, which opens when you select the schedule’s tile under Post Schedule on the Social page.
Add a market
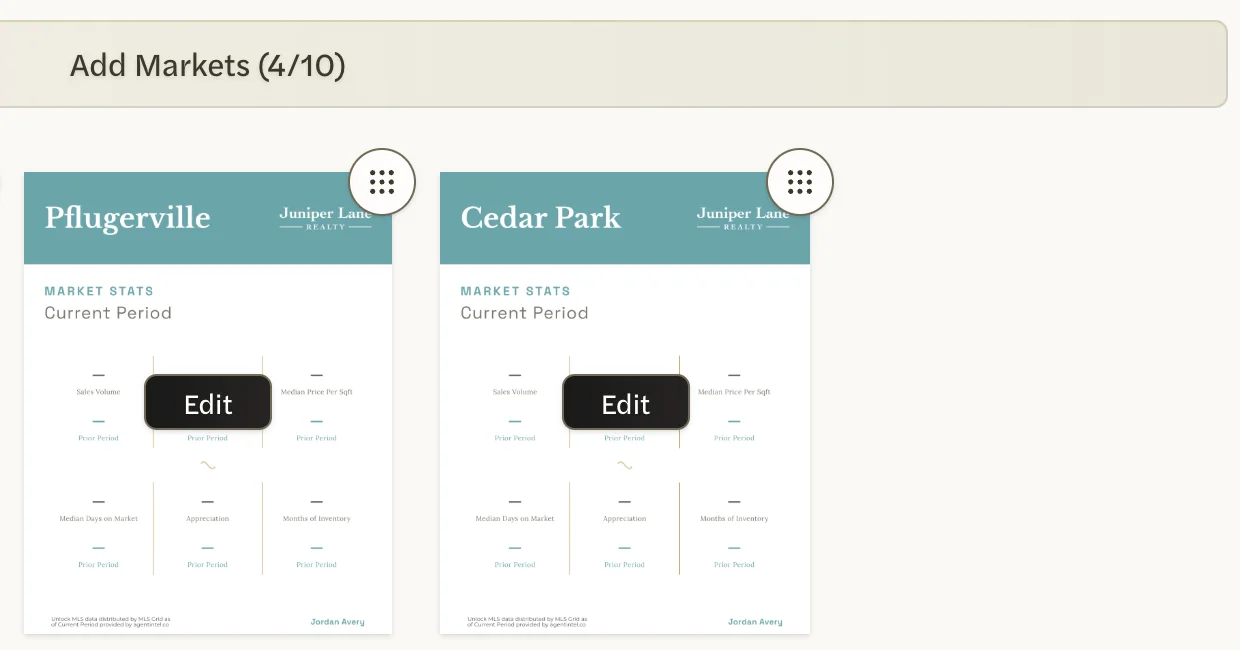
Under Markets, point to or select Add Markets. The button shows how many markets you have, such as Add Markets (3/10), and turns into a search box.
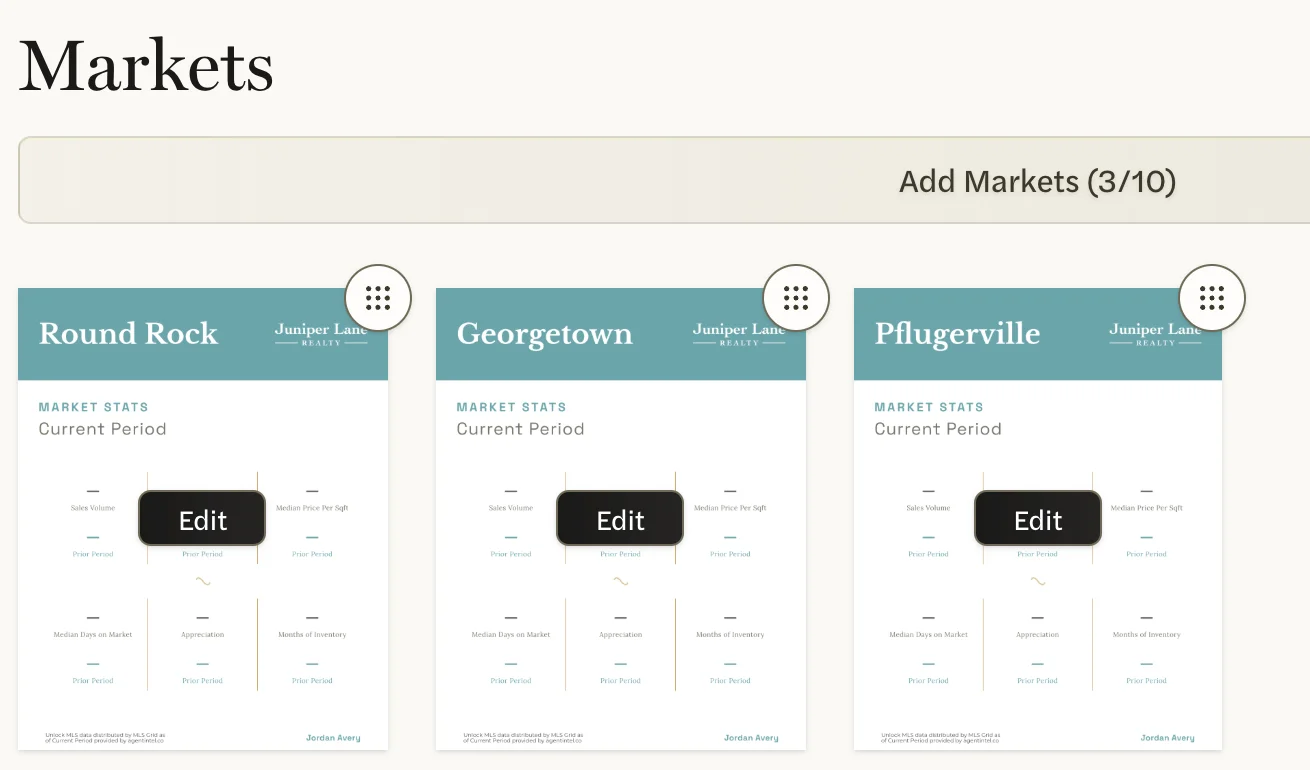
Type the name of a market. Before you type, the list shows the markets you opened most recently.
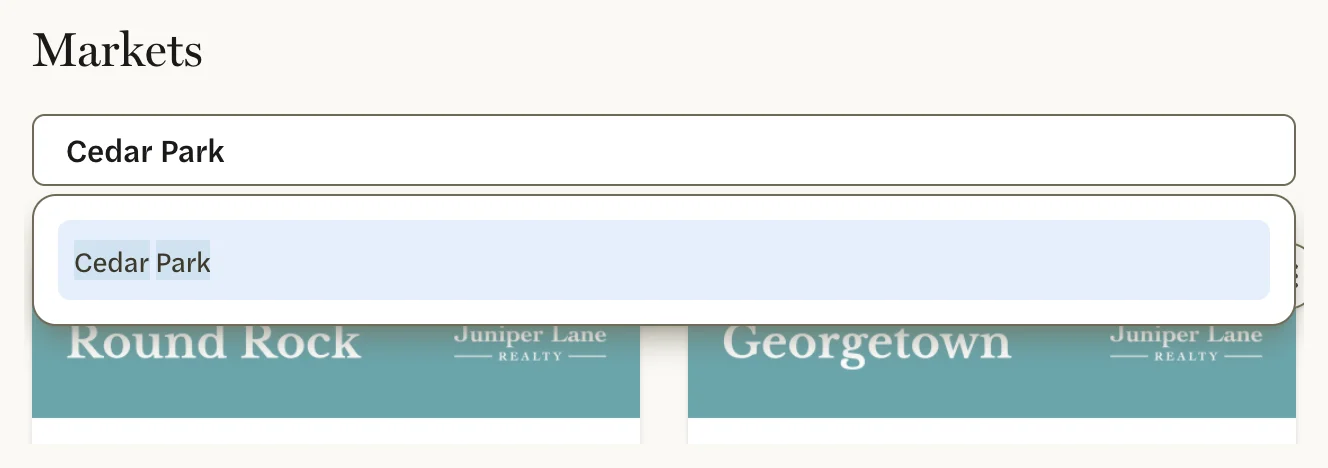
Select the market. It is added as a new image at the end, and the count on the button goes up by one.
With an MLS Connection, you can add your MLS’s metro areas, counties, cities, zip codes and neighborhoods, the whole MLS, and your custom markets. Without one, you add national markets: the whole country, states, metros, counties, cities, zip codes and neighborhoods. Once a post has 10 markets, the button reads Limit Reached (10/10); for more, make a second post or schedule.
Rename a market
The name is the large title on the market’s image, and it is the name the caption uses.
Select Edit on the market’s image.
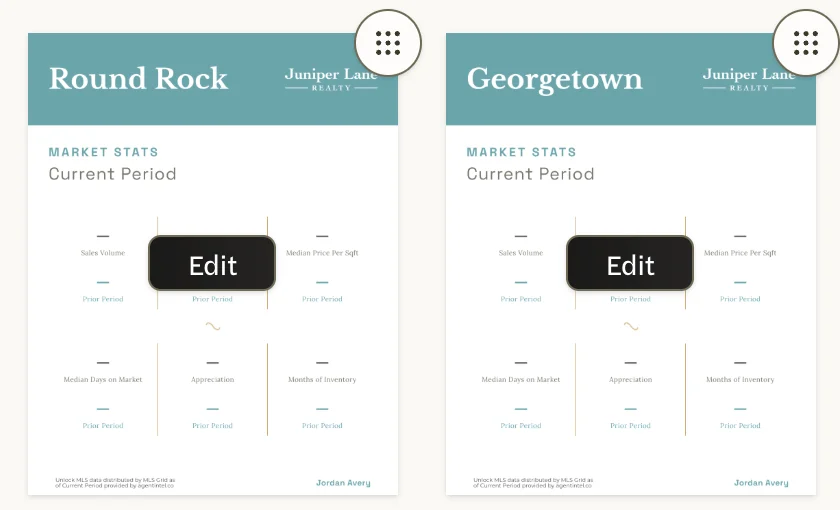
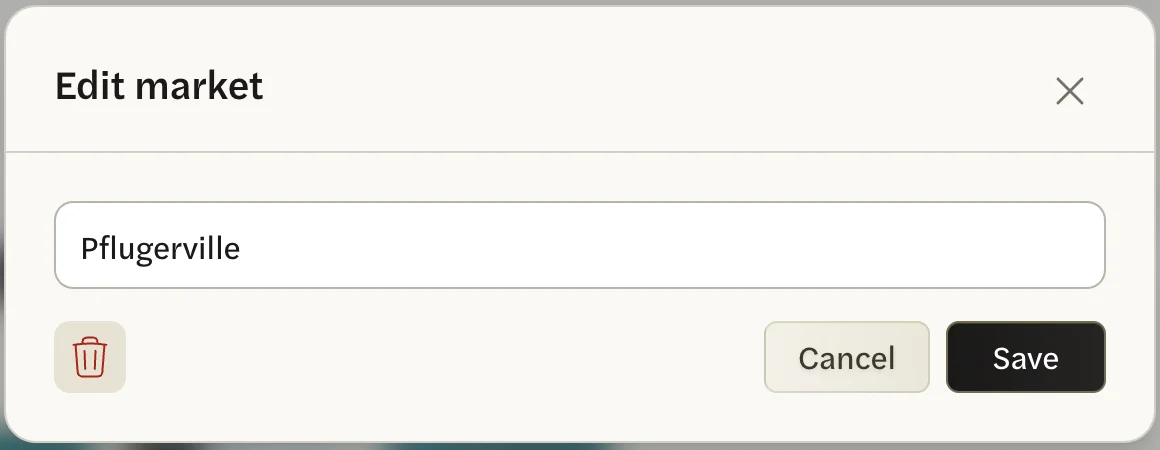
Change the name in the box at the top of Edit market.
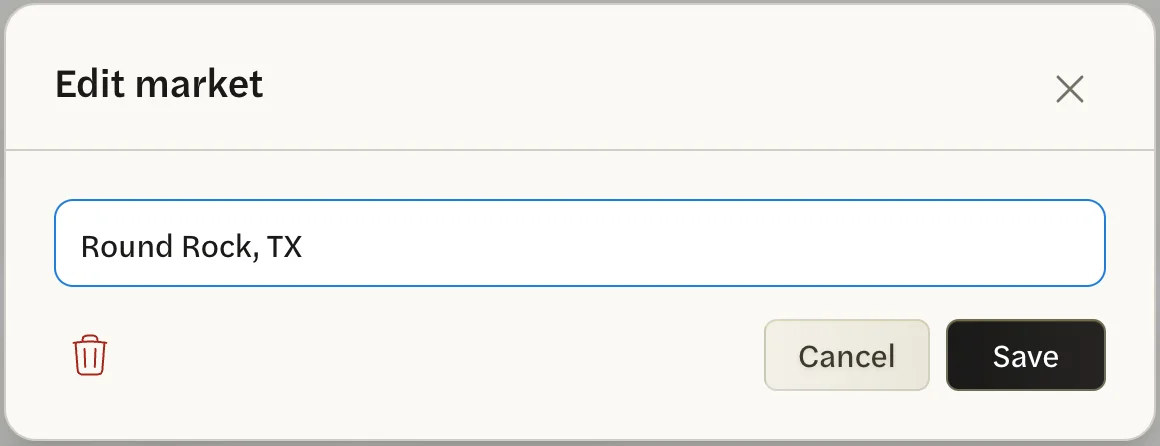
Select Save.
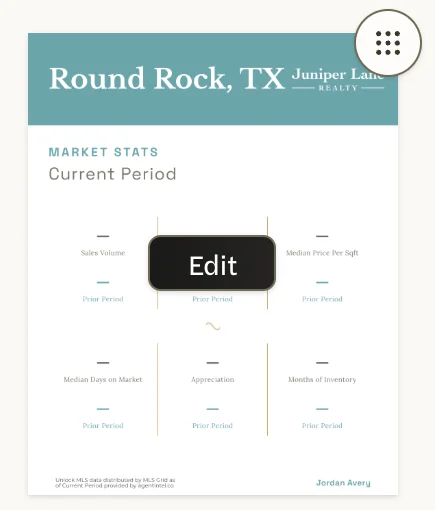
The new name appears on the image. It changes the name only in this post or schedule, not anywhere else in AgentIntel.
Change the order
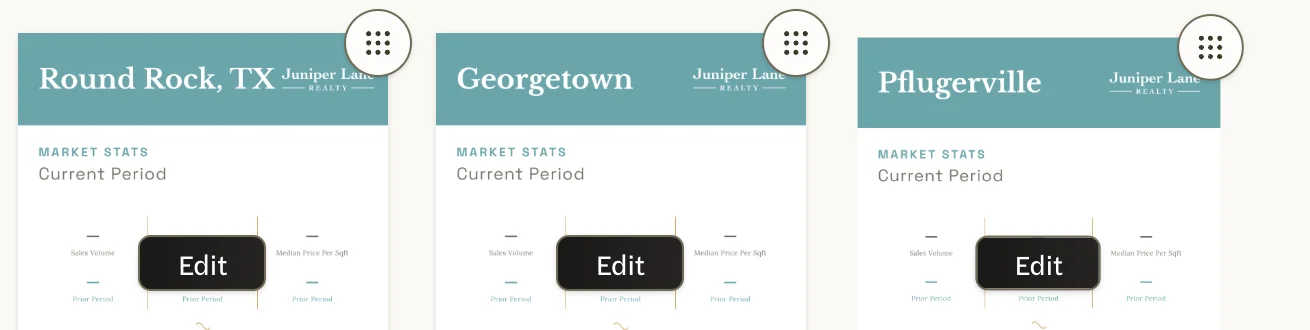
Drag a market by the round dotted handle at the top-right corner of its image, and drop it where you want it. The order of the markets is the order of the images in the post. On a schedule, the first market is also the picture on its tile on the Social page.
Remove a market
Keep at least one market in every post and schedule.
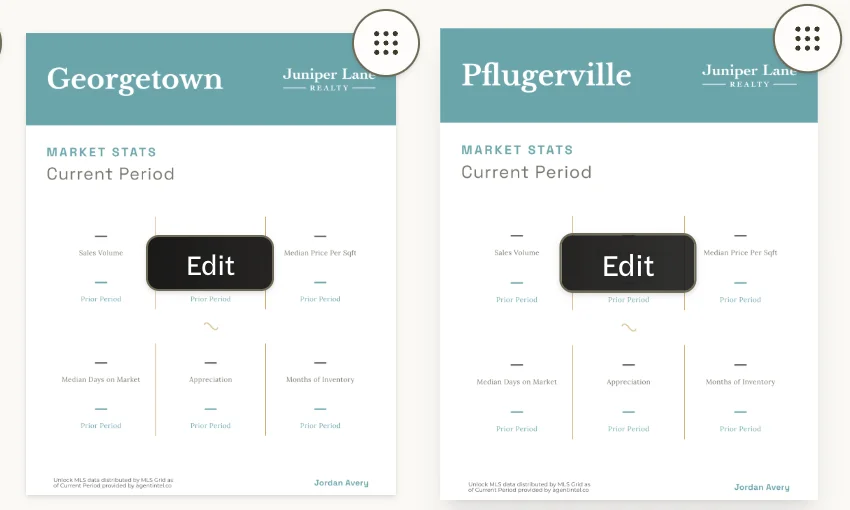
Select Edit on the market’s image.
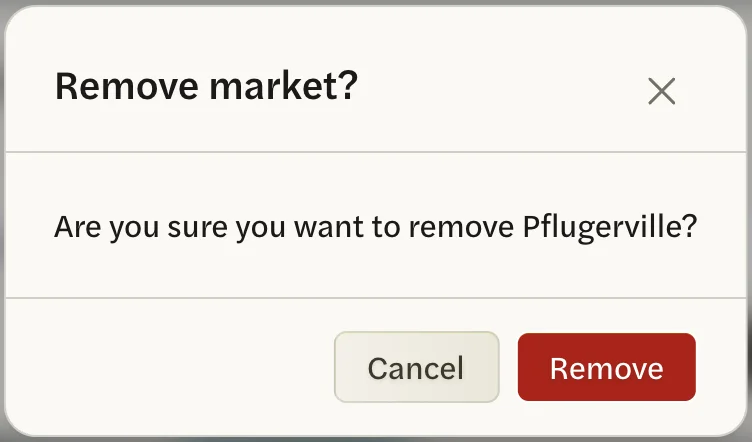
Select the trash icon at the bottom left of Edit market.
Select Remove to confirm.
Choose the statistics
Under The Statistics, choose how the statistics are picked. Every image in a post shows the same statistics, in the same order.
- Positive Indicators is the starting choice. AgentIntel picks the statistics when the post is made, ranking them by how far each moved in a good direction since the earlier period, averaged across all the markets in the post. A rise counts as good for prices, appreciation, sales and pending listings; a fall counts as good for days on market, Months of Inventory, and new, expired, withdrawn and canceled listings. The first statistic is always a dollar figure, such as a price, even if it fell. The statistics can differ from one month’s post to the next.
-
Manually Select shows every statistic in a box. Drag them into the order you want, as the note under the box says: “drag and drop to set the order”.
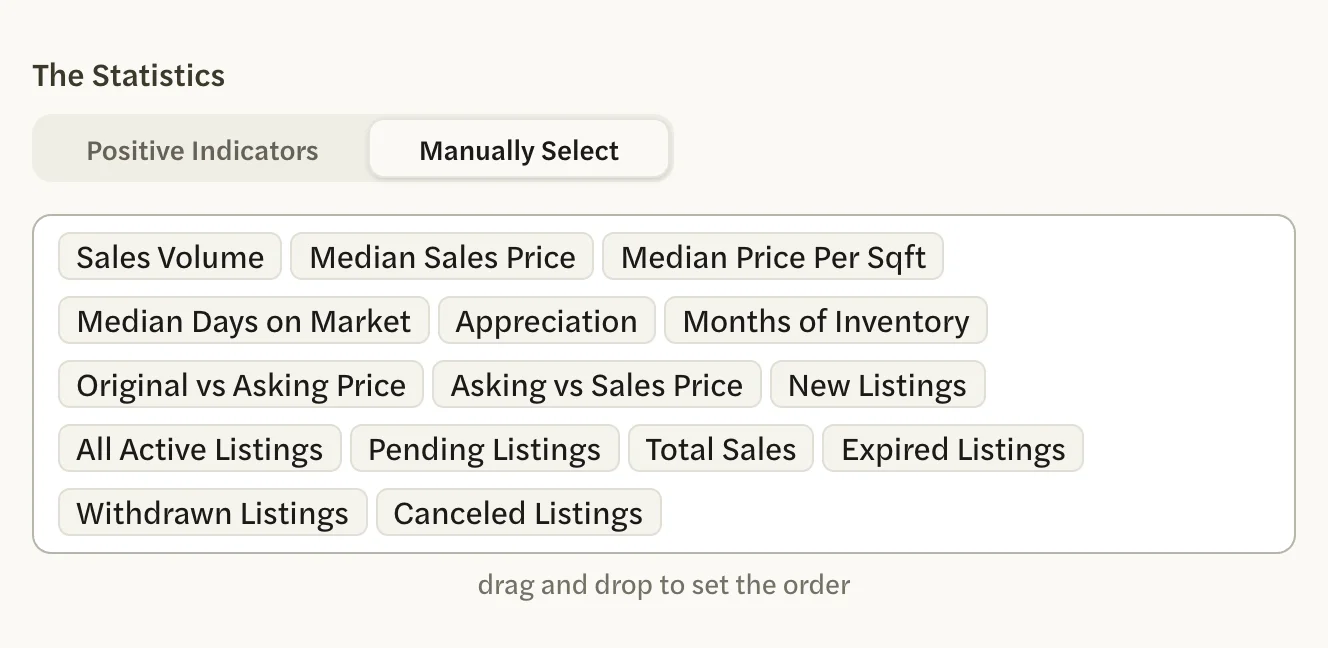
Each template shows a set number of statistics, taken from the top of the order: Two by Three 6, Info Dense 7, Modern Compare 5 and Overlay Graphic 4. What each statistic means is in MLS statistics and National statistics.
Choose the period
Under Statistics Date Range, choose the period the numbers cover.
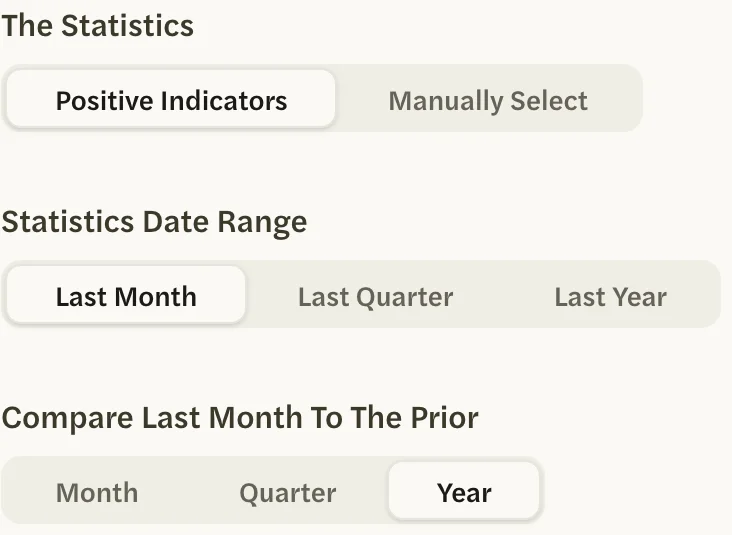
- On a post, the choices are Last Month, Last Quarter and Last Year. A new post starts on Last Month.
- On a schedule, the choices are Most Relevant and Last Month. Most Relevant changes with the month the post is made: in January it covers the last year; in April, July and October, the last quarter; in any other month, the last month.
Then choose what the numbers are compared with, under the heading that names your period, such as Compare Last Month To The Prior: Month, Quarter or Year. The comparison is the same length of time, that much earlier. With Year, a post about September is compared with the September before it. A longer period offers fewer choices: a year can only be compared with the year before.
This choice isn’t shown in two cases:
- With Most Relevant, which always compares with the same period a year earlier.
- With the Info Dense template, which shows no comparison.
Without an MLS Connection, a post’s periods are Last Month, Last 3 Months, Last 12 Months, Last Quarter and Last Year, and a schedule’s are Most Relevant, Last Month, Last 3 Months and Last 12 Months. Last Month isn’t offered when a city, zip code or neighborhood is among the markets, because Redfin publishes figures for those areas only over three months; see MLS and national data. On these schedules Most Relevant uses the latest 12, 3 or 1 months of Redfin’s data, by the same months as above, and a schedule that includes a city, zip code or neighborhood uses 3 months in every month but January.
When your changes apply
A schedule’s changes apply to its next post. Posts already made keep their markets and numbers, and a finished post can’t be changed except for its caption.