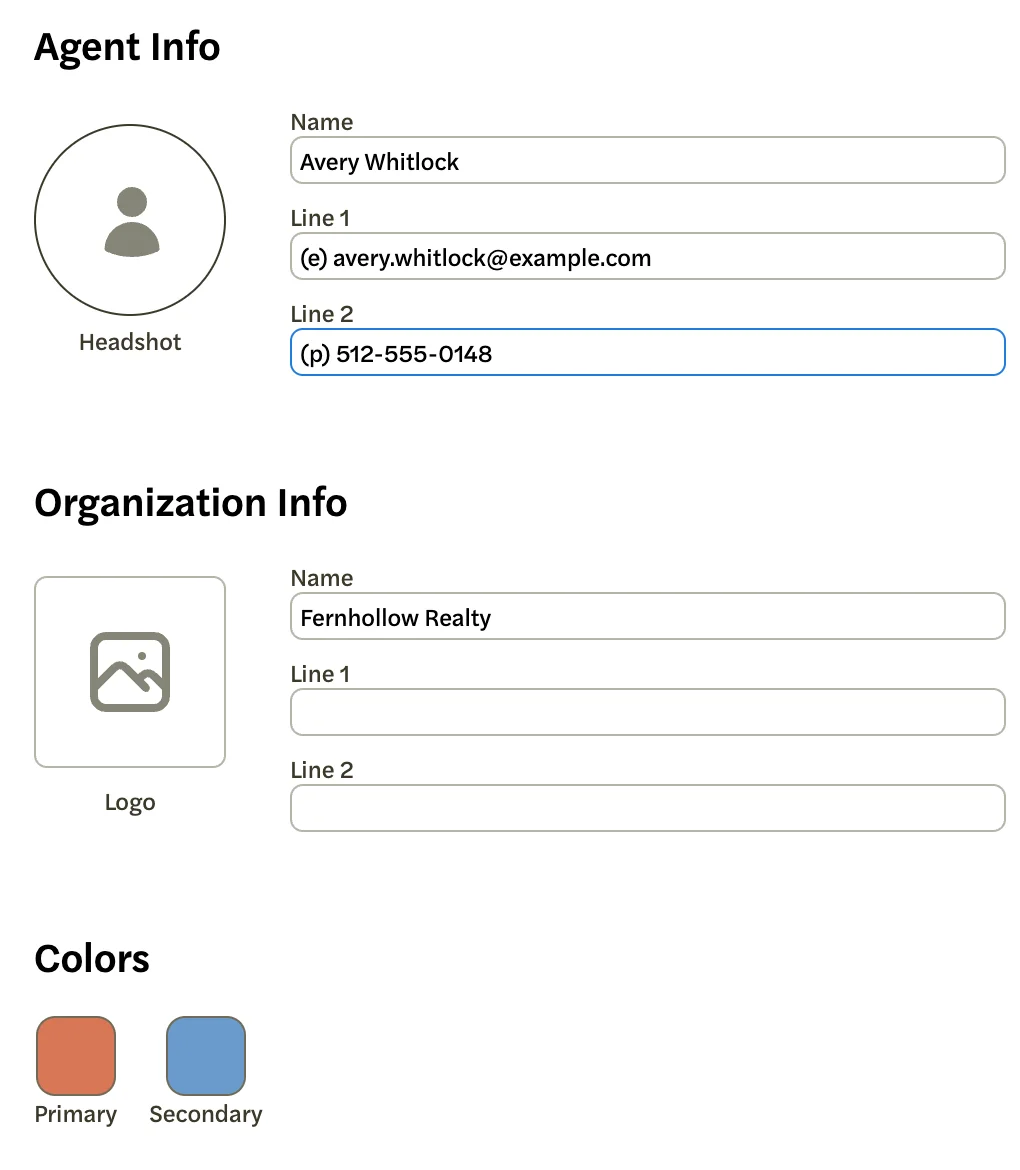
Select Reports, type the name of a place and pick it from the list. Your first report opens on a Customize Report screen showing the name, contact lines, logo and colors it will carry. Check them, select Save & Generate, and the finished report opens, ready to share.
Make your first report
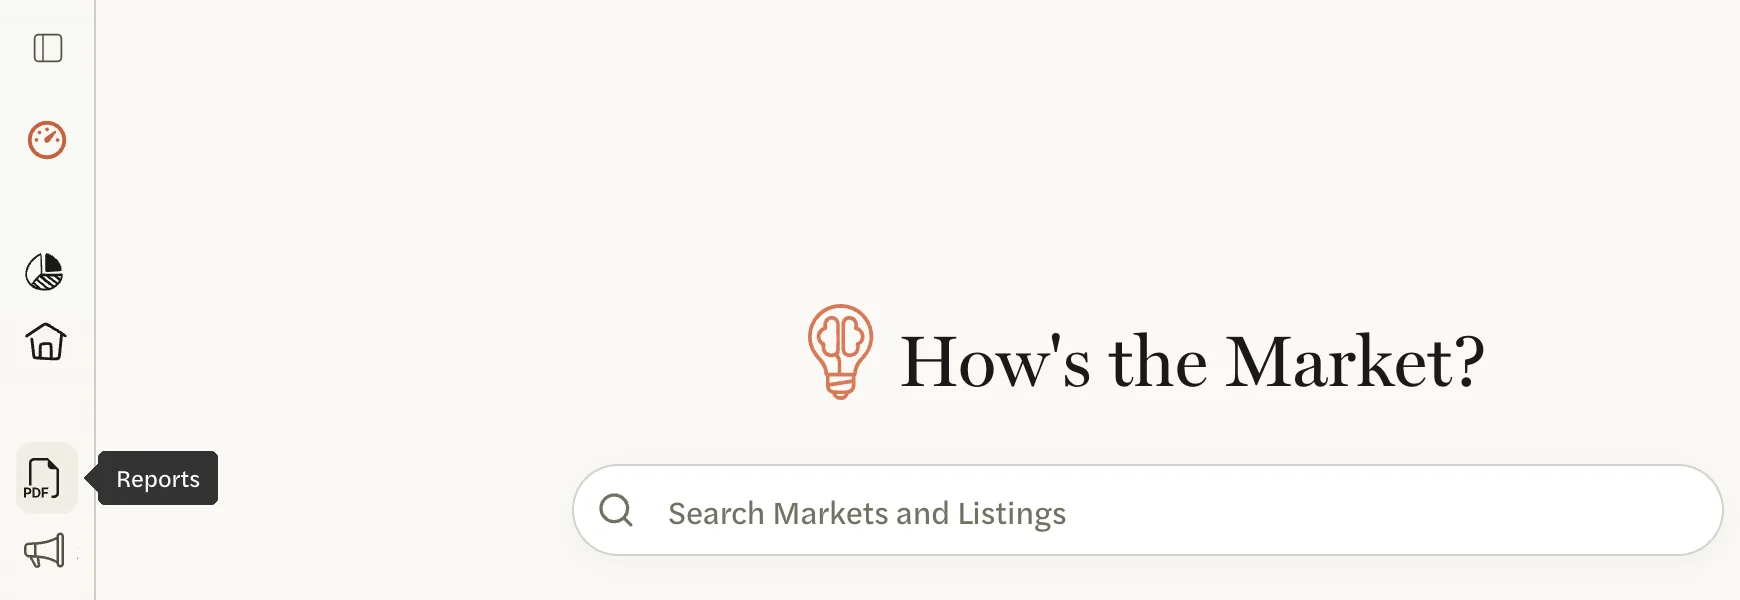
On your Dashboard, select Reports in the left menu. If the menu shows only icons, Reports is the icon marked PDF.
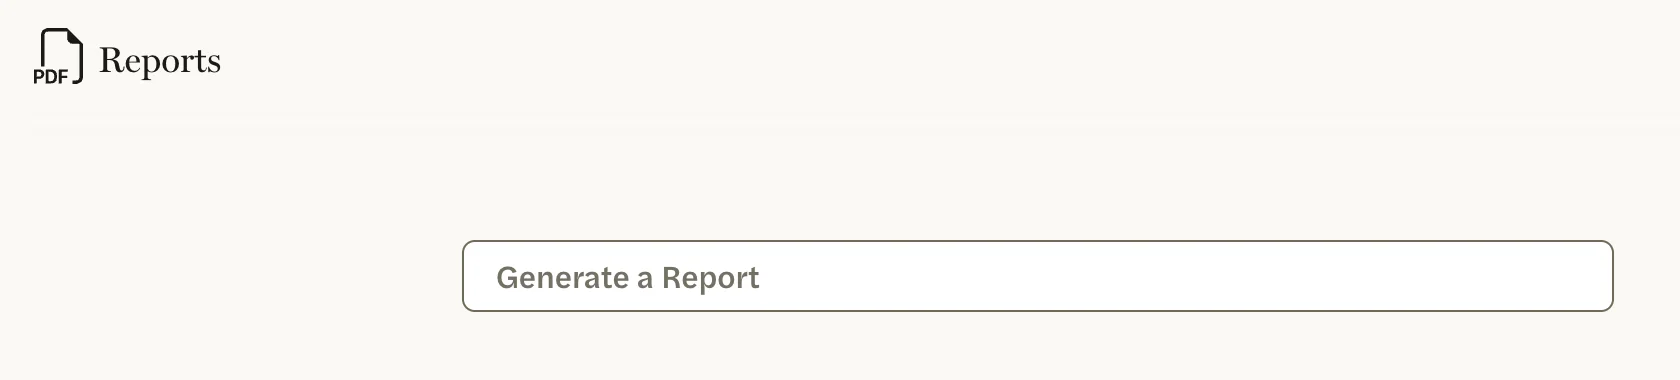
Select the Generate a Report box and type the name of a place, such as a city, county, zip code or neighborhood. On a new account the box lists nothing until you type.
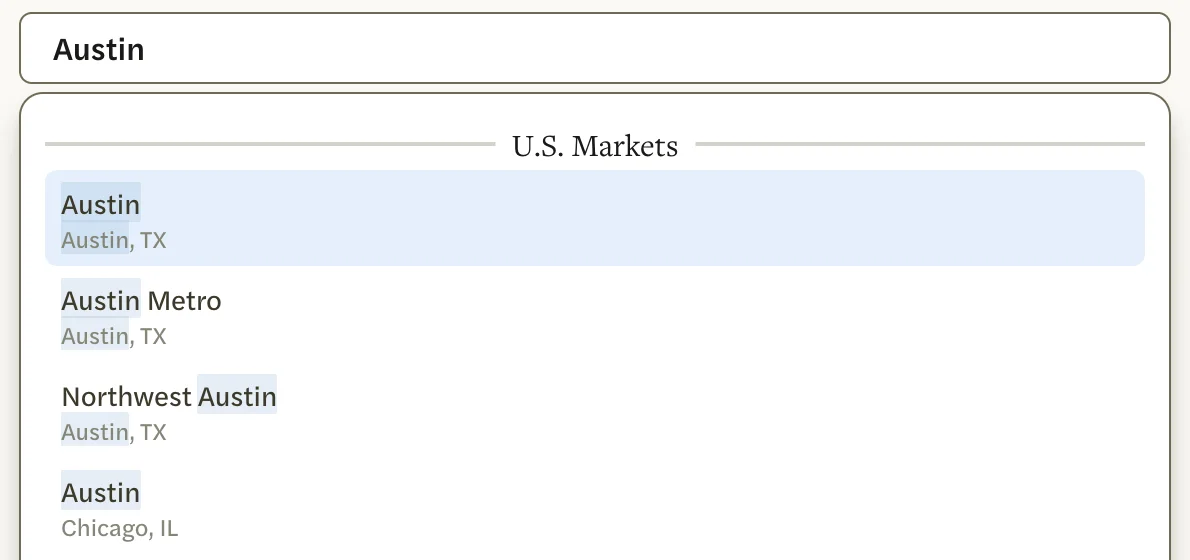
Find your market in the list. Several places can share a name, so check the line under each one, such as “Austin, TX”. Selecting a market starts the report straight away; there is no confirm button.
Select the market. A new tab opens on the Customize Report screen: your report settings on the right, and on the left a preview of a report that uses them.
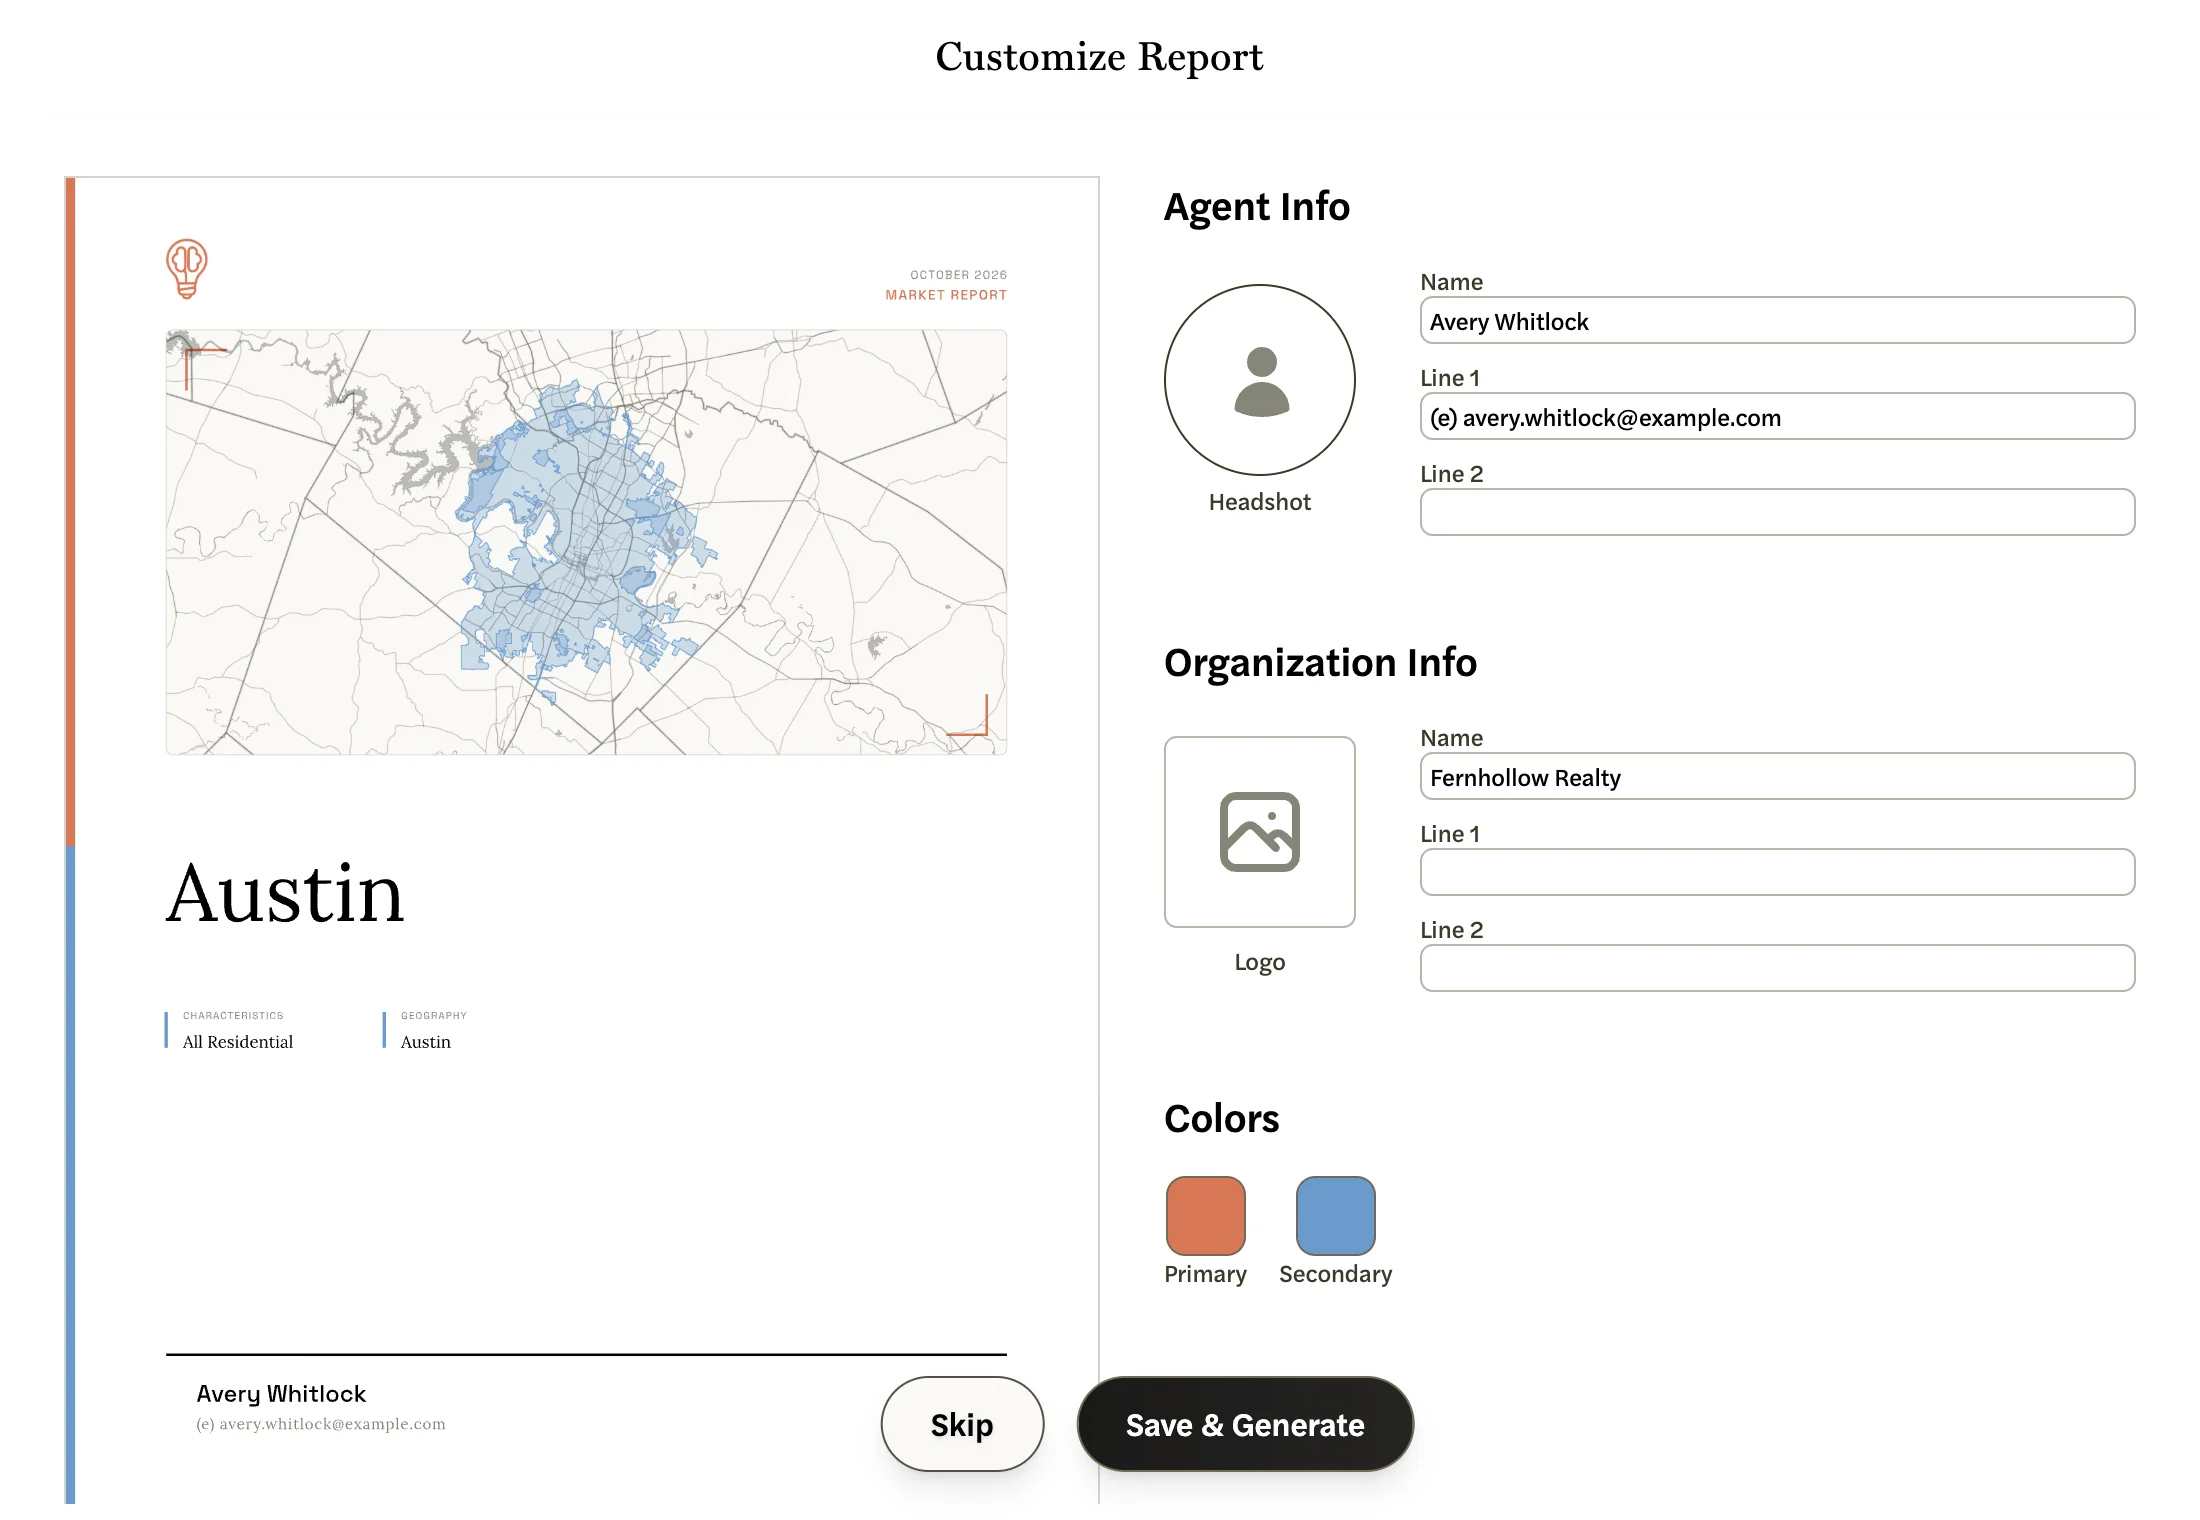
Check the settings, as described below. Anything you change saves as you type, and the preview redraws.
Select Save & Generate.
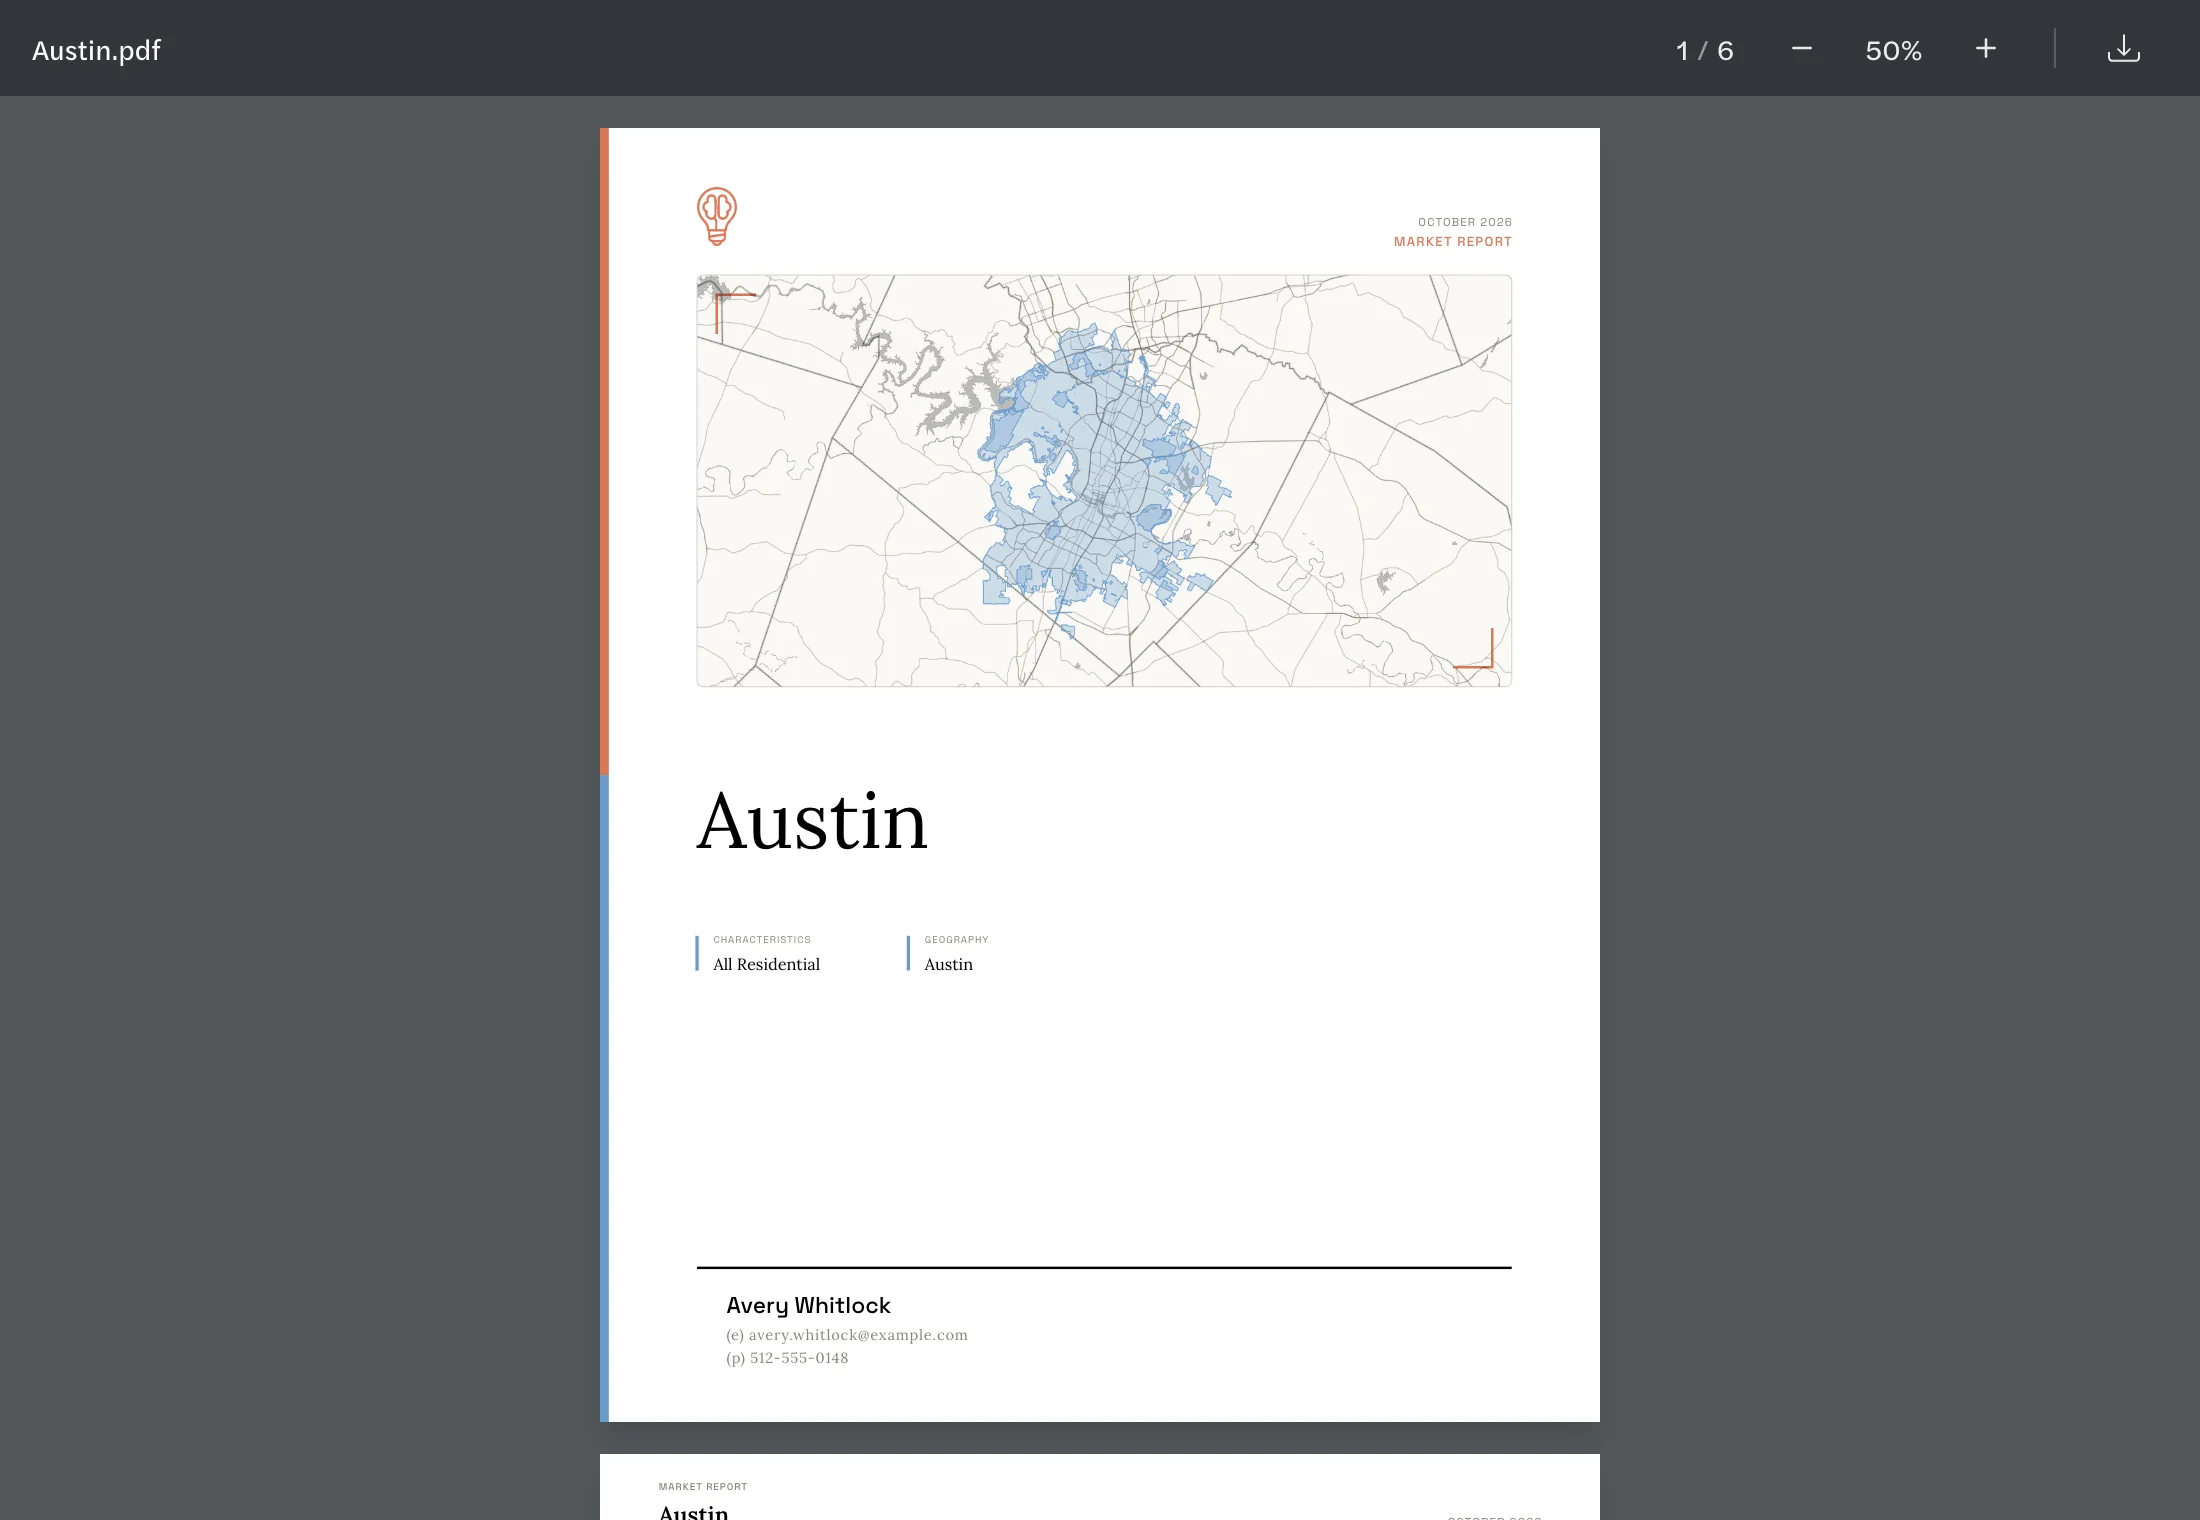
The tab says “Generating Report” while the report is built, then shows the finished report in a viewer, where you can page through it and download the PDF. The report is also listed at the top of your Reports page. To send it to a client, see Share or download a report.
What to check on the Customize Report screen
When you join, AgentIntel fills in what it can of these settings, so the preview may already carry your logo and colors. Where your branding came from explains what is filled in, and from where.
- Agent Info: your Name, and Line 1 and Line 2 for how clients reach you. They print at the bottom of the cover and at the bottom left of every other page. If you joined without your MLS profile, Line 1 is “(e)” followed by the email address you sign in with, and Line 2 is empty: change the email if clients should use another one, and add your phone number.
- Organization Info: your brokerage’s name and address, which print at the bottom right of every page except the cover, and the Logo square.
- Colors: the Primary and Secondary colors of the charts and accents.
- The round Headshot circle, for a photo of yourself.
If anything filled in for you is wrong, such as an old brokerage’s logo or the wrong colors, change it here, or see Change anything that’s wrong.
A lightbulb where your logo goes means no logo was found, and orange and blue accents mean no colors were found: those are AgentIntel’s own mark and colors. The screen below shows both.
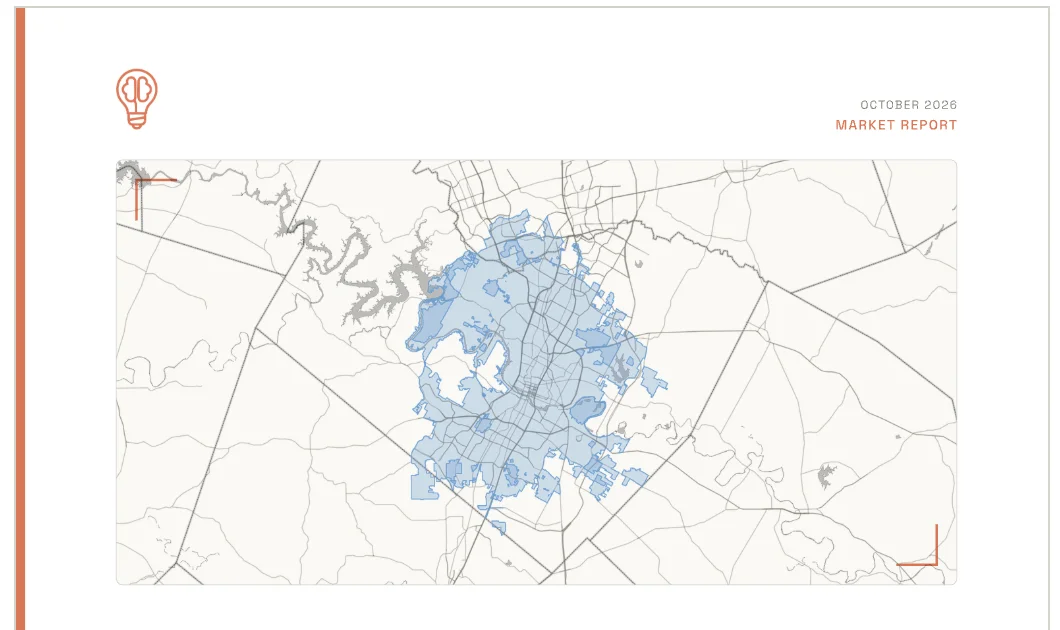
You can add your logo and colors here before you select Save & Generate; the Logo square and the color squares work as described in Set up your branding. Or select Save & Generate now and set them up afterwards: every report you make after that carries them.
Your MLS’s markets are offered only with an MLS Connection. Without one, the list shows national markets, under U.S. Markets. See Connect your MLS.
What happens next
- The Customize Report screen doesn’t come back. After Save & Generate, your next reports go straight to the finished report. If you select Skip instead, the report is made the same way, but the screen appears again with your next report. Either way, you can change your settings at any time with customize on the Reports page.
- A report keeps the branding it was made with. If you change your branding afterwards, make a new report to see it; this one stays as it is. Reports can’t be deleted, so every report you make stays on your Reports page.
- No new tab opened? See No new tab opened, or my report keeps saying Generating.
- Other ways to make a report, such as from a market’s page for one property type, are in Generate a report. What each page shows is in What’s in a report.
Next, set up your branding so your reports carry your logo and colors.