Three controls on a market page change what it shows: the version button under the market’s heading, which switches between versions such as Residential and Condos; the period above the listing counts; and the two periods compared in Indicators. If you haven’t opened a market yet, see Find a market.
Switch to another property type
Open a market and select the button under its heading, such as Residential.

Choose another version from the list. The page reloads with that version’s numbers.
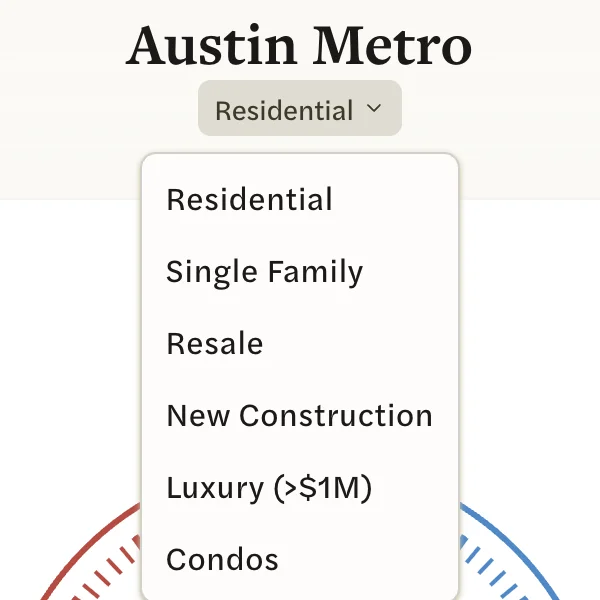
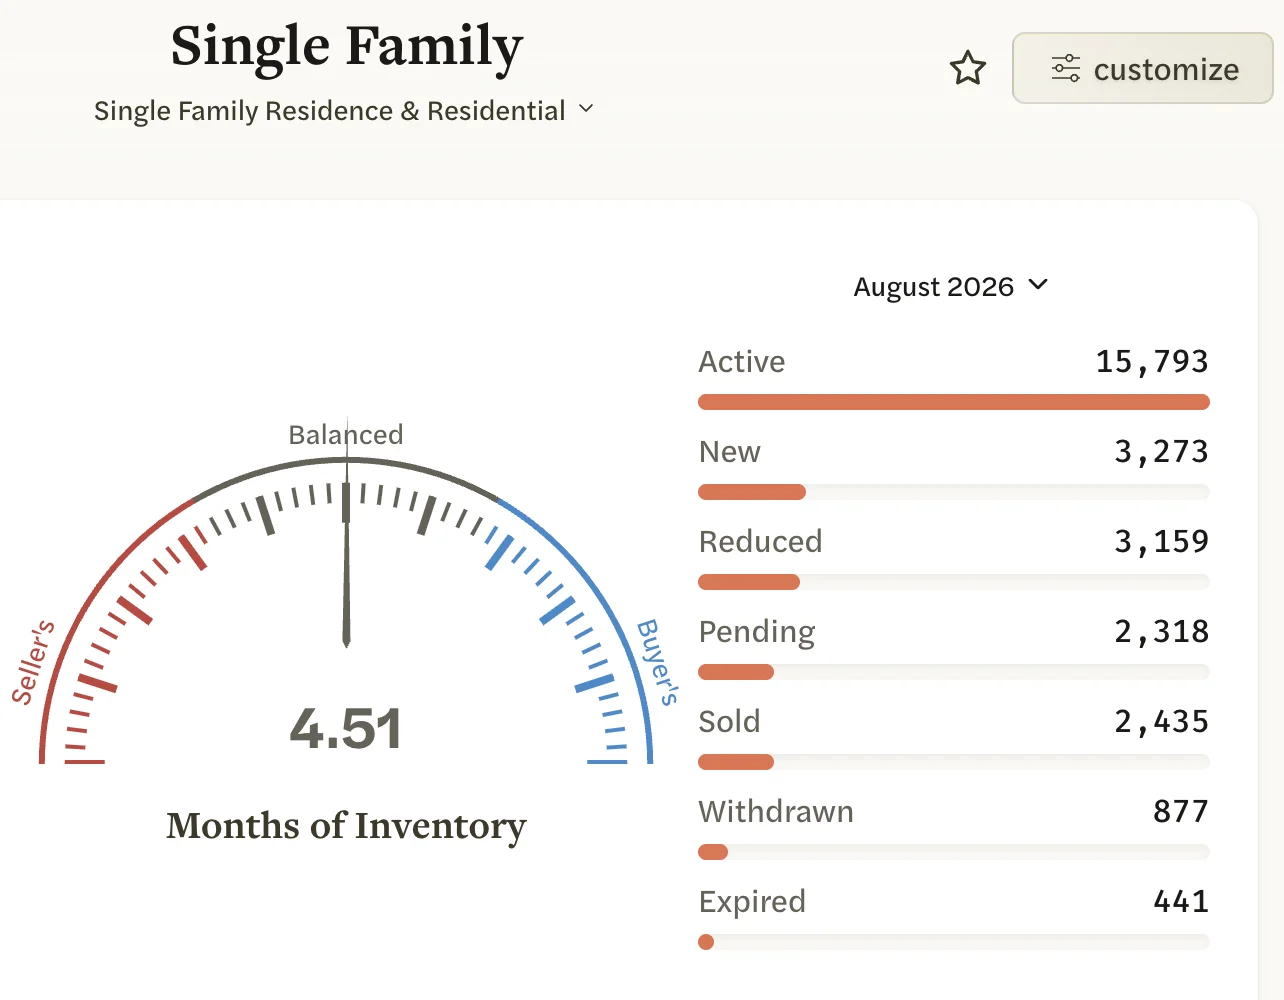
The list depends on the market:
- A market from your MLS lists the versions AgentIntel offers for that area, such as Single Family, Resale, New Construction or Condos, and any custom markets you have made for the same area. For a property type that isn’t listed, create a custom market.
- A national market lists All Residential, Single Family Residential, Condo/Co-op, Multi-Family (2-4 Unit) and Townhouse, leaving out any type with too few sales in that place. National markets can’t be customized.
Change the period of the listing counts
Select the button above the listing counts. It names the period shown, such as August 2026.
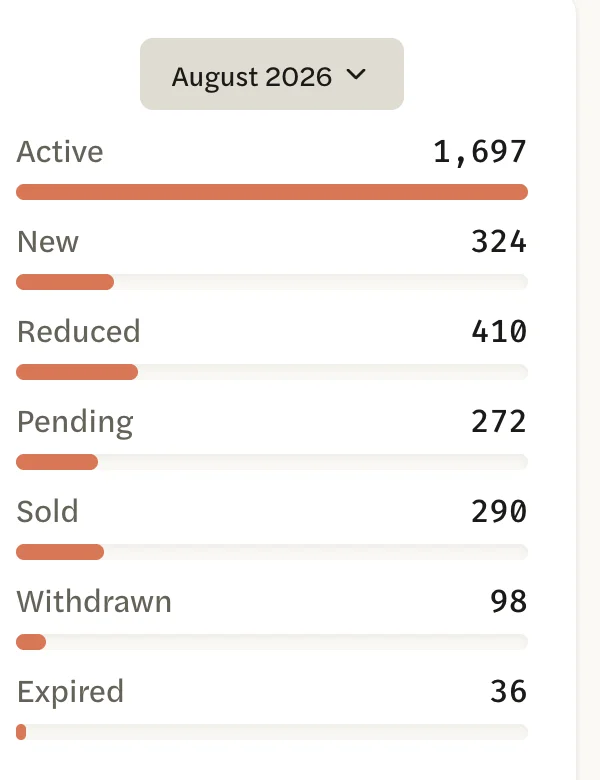
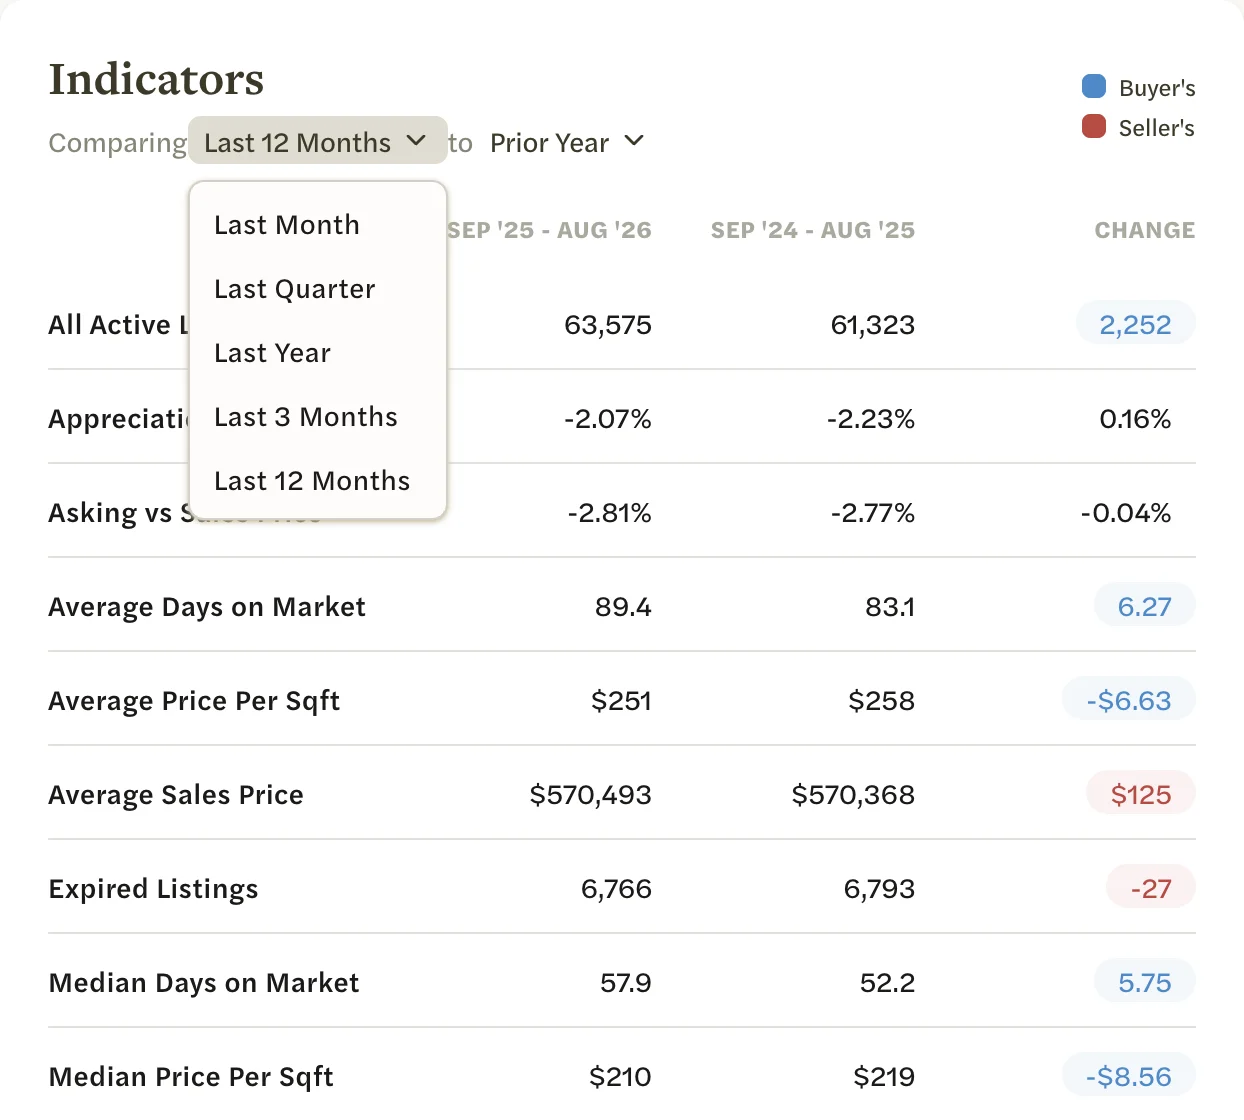
Choose Last Month, Last Quarter, Last Year, Last 3 Months or Last 12 Months.
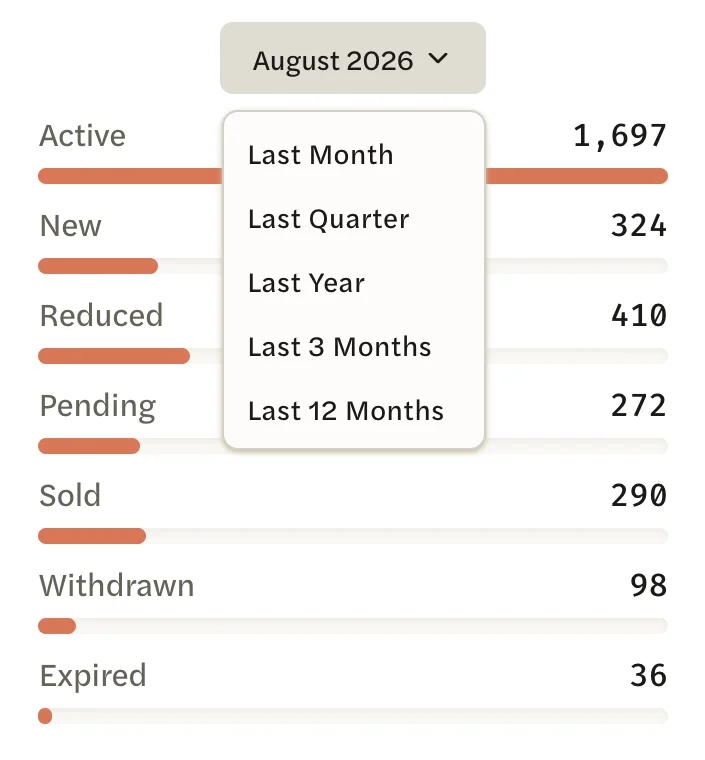
The counts reload and the button names the new period, such as 2025 or Sep ‘25 - Aug ‘26. Last Month, Last Quarter and Last Year are the most recent complete calendar month, quarter and year. Last 3 Months and Last 12 Months run up to the end of the most recent complete month.
A national market offers the same five periods in a different order. They end with the latest month Redfin has published, which runs a month or more behind.
Compare two periods in Indicators
Scroll down to Indicators.
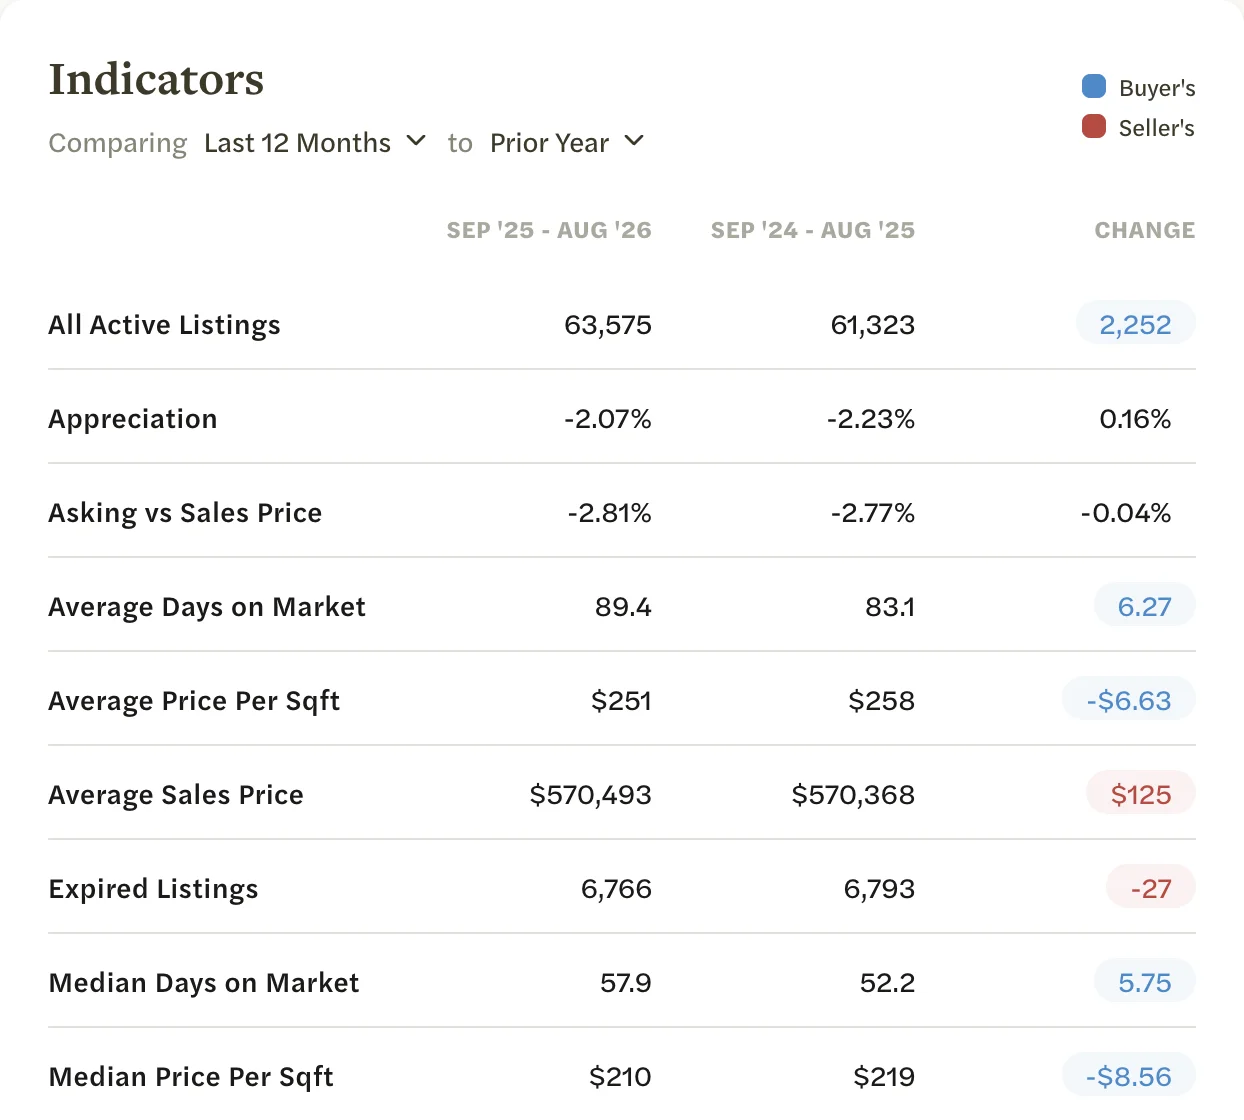
Select the period after Comparing and choose the period you want figures for: Last Month, Last Quarter, Last Year, Last 3 Months or Last 12 Months.
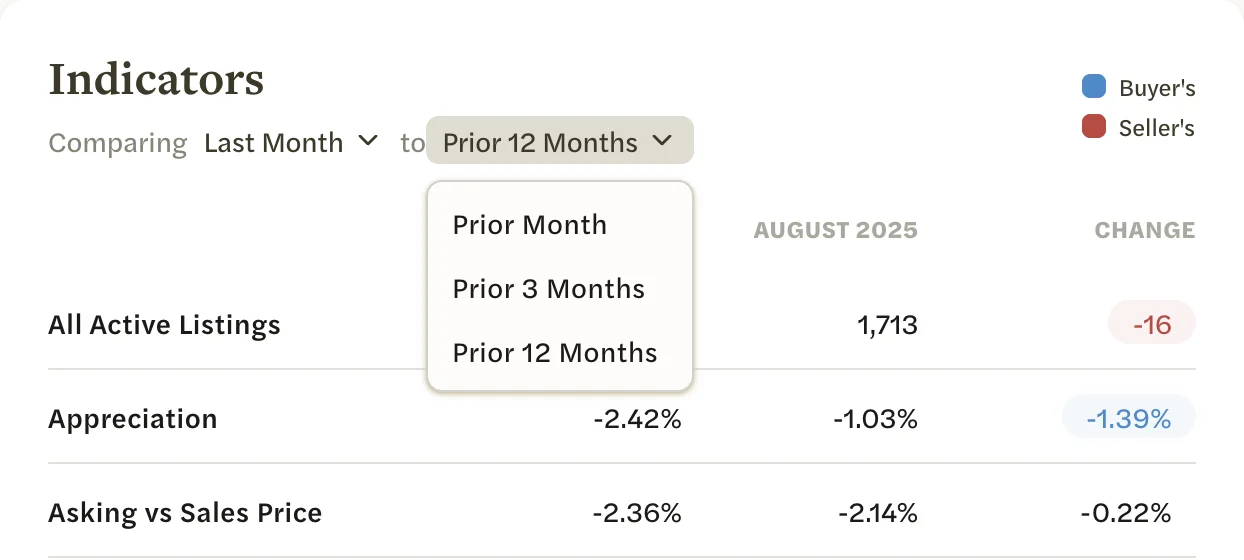
Select the period after to and choose what to compare it with:
- Prior Month: the month before. Offered only with Last Month.
- Prior 3 Months: the same length of time, three months earlier. Not offered with a year or 12 months.
- Prior 12 Months: the same length of time, a year earlier.
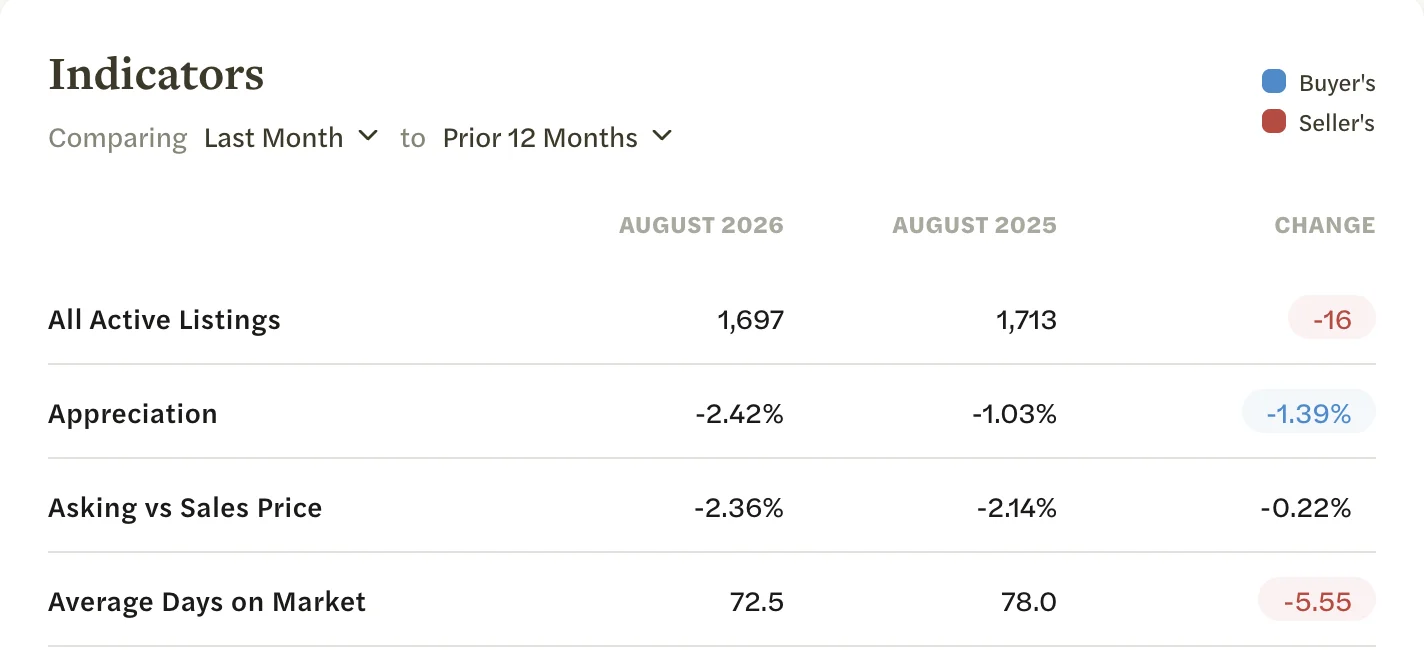
The table reloads. The headings above the second and third columns name the periods being compared, and CHANGE is the difference between them.
A market starts at Last 12 Months to Prior Year: the last 12 months against the 12 months before. If you change the first period and your to choice no longer fits it, it switches to Prior 12 Months.
On a national market, the to choices are Prior Month, Prior Quarter and Prior Year, and the table starts at Last Month to Prior Year. Choosing a new first period resets to to Prior Year.
To read the colors in the CHANGE column, see Read a market page. For what each statistic means, see MLS statistics or National statistics.
What stays the same
- Your choices stick. On a market from your MLS, AgentIntel keeps the periods you chose for that market and shows them the next time you open it. Choose again to change them.
- The charts keep their own spans. The listing counts and Indicators are the only parts of the page these choices change. The monthly charts cover up to ten years, Negotiations and Price Adjustments the last 12 months, Job Growth the last two years and Interest Rates the last 90 days. The Months of Inventory gauge always shows the latest complete month.
- There are no custom dates. You can’t pick your own start and end dates; the five periods above are the choices.